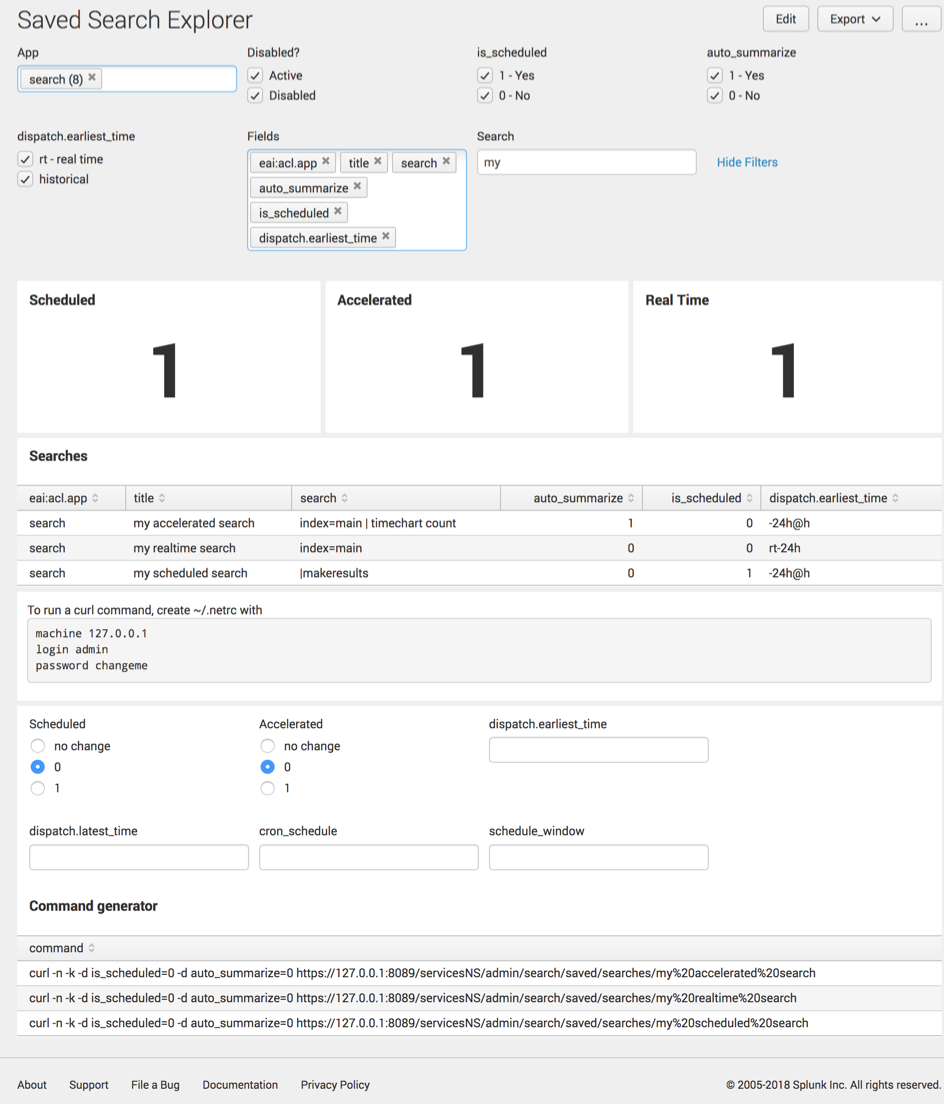
As a Splunk administrator, have you ever needed to list out your saved searches in some way? Perhaps you need to know which searches might be accelerated, scheduled, or even real-time scheduled? Here’s a quick dashboard to show this information.
The dashboard is available in this GitHub repo.

Update: I have also created a Correlation Search explorer, which is now added to the github repo as well. This new dashboard shows the data model and indexes associated with each correlation search.