I’ve been working with Splunk Enterprise a lot lately (and it’s very powerful and easy to use!). In many situations, it is useful to show some metric compared to the same metric a month ago (or some other time period).
One way to accomplish this is with the community-supported Splunk app, Timewrap. I couldn’t get Timewrap to output the data as I wanted, so instead here’s the approach that I used.
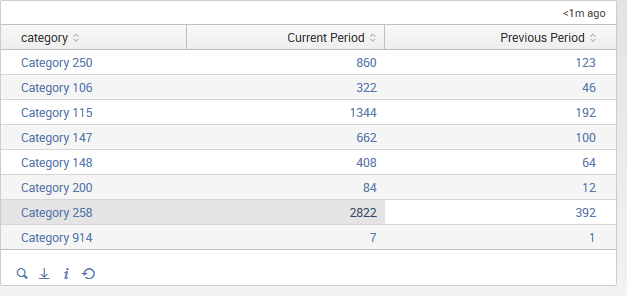
Here’s my goal:

Before we compare data from the current period to the previous period, we need to ensure the dates are consistent. This example compares data from the current day to a previous day. If you want to compare current month/year to previous month/year, refer to the Splunk documentation for the bin command.
index=foo | bin _time span=1d
Now we use the stats command to perform the comparison.
| stats count(eval(relative_time(now(), “@d”)=_time)) as “Current Period” count(eval(relative_time(now(), “-30d@d”)=_time)) as “Previous Period” by category
Explanation:
- For “Current Period”, count the events where the _time field is equal to midnight today. Remember, we just standardized all events to equal midnight of the respective day.
- For “Previous Period”, count the events where the _time field is equal to midnight 30 days ago.
If this is useful to you, or you have any more suggestions, please let me know in the comments below.