Since it is so easy to search for data in Splunk, and then create a dashboard in just a couple of clicks, you might be tempted to do just that – and release your dashboard into production. For some situations, that’s absolutely fine. But as your organization becomes more reliant on Splunk dashboards, this approach can become unwieldy. And if there’s anything we want, it’s wieldy searches!
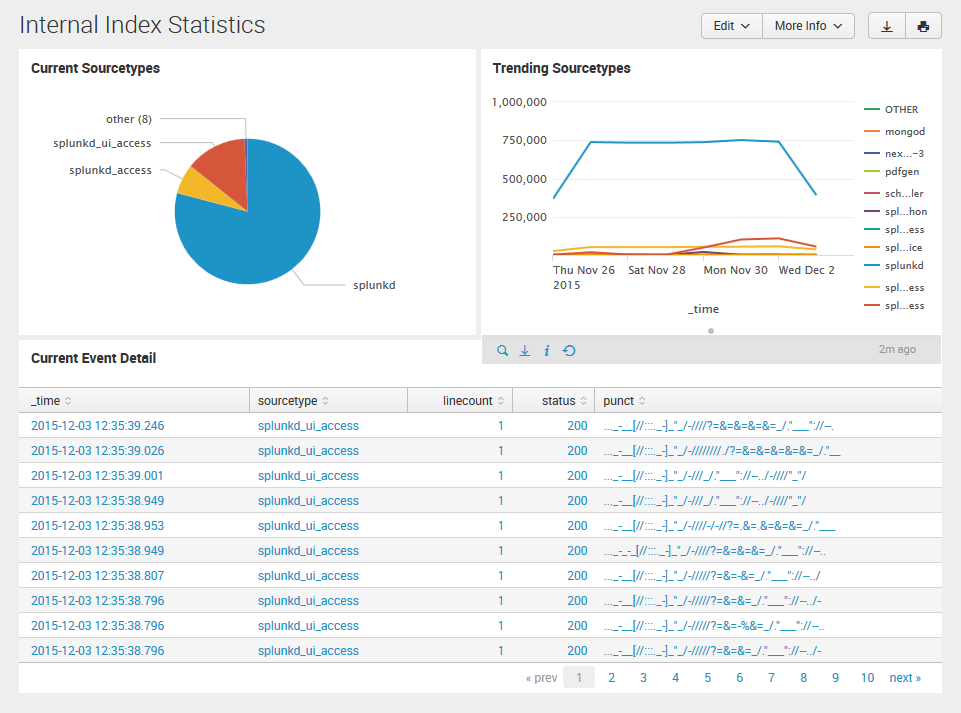
 Here’s a simple example of a typical dashboard I might create. When I was brand-new to Splunk, each of these panels would be generated by separate searches on the source data.
Once I realized the power of post-process searches, I was able to achieve a marginal improvement in dashboard performance—but the dashboard still performed all of the calculations every time a user loaded the dashboard.
Use Summary Indexing
In order to build dashboards that load very quickly, it is imperative that you do not perform calculations on the dashboard itself—only use the dashboard to display data! In order to do this, you’ll need to get comfortable with summary indexing. I found David Veuve’s post quite helpful.
Search Macros
In this example dashboard, the summary index is used for the pie and line charts, but the source data is used for the event table at the bottom. Now, one of the first concepts we learn as software engineers is DRY.
How can avoid repeating the calculations are performed on the detailed data as the summarized data that generates the charts? Easy: Use Search Macros!
The first part of the saved search that writes to the summary index will be the search macro, followed by the necessary “stats” command(s) to build the summary data. Then, in the detail section of the dashboard, call the search macro again, (constrained to a reasonable time period) followed by the “table” command or perhaps some other commands to filter the events to meet the business requirements.
When the time comes where it’s neccessary to change the search definitions for the dashboard, you only need to change the search macro (Of course, you’ll have to flush and backfill your summary index). In the meantime, your dashboard will load very quickly and your users will be happy!